News
Range of beach inundation (pilot areas) The extent of beach inundation expressed as a percentage, calculated for three study sections using the XBeach model
 Fig.1 Diagram showing the beach inundation.
  Fig.2. Colour scale of the beach inundation.
 Fig.3 Tourist infrastructure on the beach near the Dziwnów Spit (Mierzeja Dziwnowska).
The extent of beach inundation depends on hydrodynamic parameters, namely, the deep-water wave action (height and direction) and water level, and also on the sea-shore’s transverse profile. Long-term onshore winds or the passage of a low pressure system leads to a local rise in the water level. Normally, the accompanying storm phenomenon causes the swash to run farther up the beach than usual: in some cases the entire beach may be inundated. The extent of beach inundation is defined as the percentage of the beach width inundated by waves, counting from the water line to the base of the dune or cliff (Fig. 1).
Methodology
The beach inundation index in the SatBałtyk system is defined by comparing the maximum extent of swash run-up on to the beach with the overall width of the beach. The overall width of the beach is computed on the basis of GPS RTK field measurements from the water line for a water level of 500 cm (mean sea level) to the dune base. The maximum beach inundation is defined using the XBeach prognostic model, which identifies the extent of inundation as the boundary between ‘wet’ areas, covered by incoming waves, and ‘dry’ ones. This index is divided into 4 equal parts, each accounting for 25% of the beach width. The colour scale shows how far waves encroach onto the shore (Fig. 2).
Validation
The accuracy of the extent of beach inundation is estimated by comparing the extent of inundation calculated using the prognostic model with the extent of inundation determined from photographs taken by the camera installed at Dziwnówek on the Dziwnów Spit or from photographs/films taken by the cameras recording incoming waves during a short storm event in 15-minute series for the Jamno and Bukowo Spits and the Hel Peninsula. The statistical error, i.e. the mean difference between measured values and those calculated using the model, is ca 5.9 m, which is 16.4% of the width of the test beach at Dziwnówek. More information: validation of the extent of inundation.
Interesting phenomena
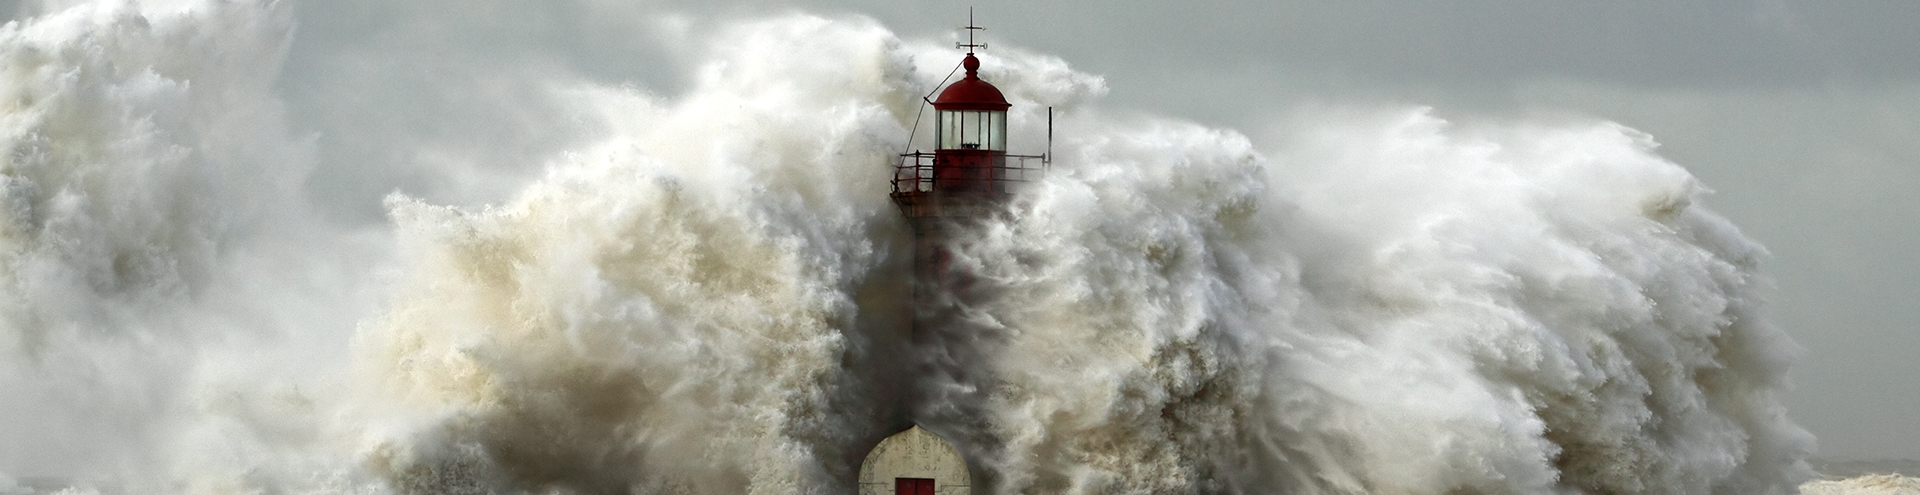
This index permits one to assess the threats and risks associated with extreme values of beach inundation. It will significantly improve the safety of persons using the beach and reduce possible financial losses incurred as a result of damage to tourist infrastructure (buildings), which is often erected on the beach itself (restaurants, inflatable air bags for jumping, slides, beach football pitches etc. (Fig. 3)
Range of beach inundation (pilot areas)

|
Powstańców Warszawy 55 81-712 Sopot, Poland |
|
Write to us: |

